By Senior Research Officer Institute for water research, Rhodes University and Sêr Cymru Research Fellow, Swansea University
Can you name the river closest to where you live? Have you ever seen that river on a map? How would you react if you saw that river, and others near you, in a map unlike others you have seen before?
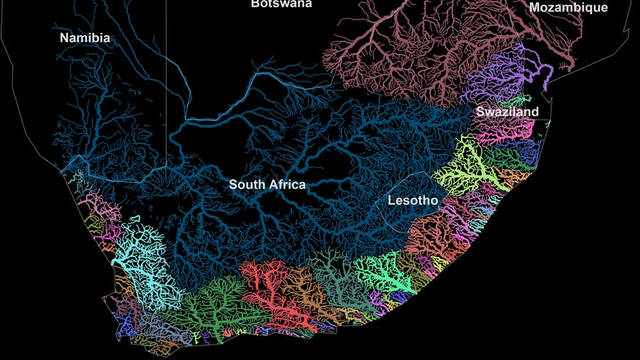
We have spent a lot of time considering these questions and others related particularly to maps since a map of southern Africa’s rivers that one of us, Sukhmani, created and posted on Facebook. The post went viral.
And though it didn’t start out strictly as “science” – it was created on a whim after seeing a map of US rivers – the map has provided us with valuable insights into how scientists and researchers can use maps to engage with broad audiences beyond the usual journals and conferences.
The map was shared thousands of times in the months after it was posted on Facebook. A high-resolution version was accessed more than 2000 times in five months by people from 48 countries, many of them outside southern Africa.
These figures may not sound high in a world of viral online content. But, as researchers who are not necessarily used to such abundant public engagement, we were so surprised by the response that we asked those interested in downloading the map to complete a survey so that we could begin to better understand what it was about the map that sparked their interest.
Our initial findings echo those emerging from a growing field of study, viral cartography. The rise of open data and mapping platforms like Google Earth and QGIS is turning maps and other spatial information into powerful tools for advancing knowledge.
Essentially, maps can show “the big picture” to a great many people. They can tell people an enormous amount in an engaging and often colourful way, revealing everything from real and hypothetical voting patterns to the layout of a region’s rivers.
Our hope is that other researchers who want to share knowledge, source information and engage with the public can learn from – and build on – this story of a river map gone viral.
Why maps matter
Maps have fascinated people for centuries. In recent years, research has shown that they can elicit emotional responses. After all, maps are inherently political. What we see on a map either aligns with our view of the world, or doesn’t. When it does, we share the map because it confirms our beliefs. When it doesn’t, we hit “share” because we want others to see what we’re criticising.
Maps are also inherently incorrect, and can be misleading. This is because they depict three-dimensional earth on a two-dimensional space. We cannot (yet) capture all the detail of earth’s surface in a single map.
It’s also important to remember that maps aren’t perfect. They can contain errors, or leave out information that would help people understand what they’re seeing.
So, how did these factors play out in relation to the rivers map?
Going viral
Through an initial review of responses to our questionnaire we identified several themes related to why people might have been interested in downloading the rivers map. These also linked to broad characteristics that were previously shown to give particular internet memes a competitive advantage, and to spread.
Broadly speaking, the characteristics of internet content with a competitive advantage are that it: 1) is genuinely useful to people; 2) is aesthetically pleasing or easily imitated by the human brain; and 3) answers a question of interest to a diverse group of people.
Respondents identified the rivers map as being genuinely useful to them. They appreciated that the map was freely accessible and that they could download it to share with family members and friends.
Second, respondents found the river map as aesthetically pleasing. One person noted that, had such a map been available when they were in school, it would have made learning geography more memorable. This is another reminder that art, in many forms, can bring “unseen” elements of science and nature to diverse audiences.
This response also chimes with research that suggests that colours in an image can influence how it spreads in social media. Red, purple and pink have been found to be particularly useful when promoting an image on social media.
Third, respondents indicated that the map helped them understand the distribution of the rivers and the land over which water flows in southern Africa. This group was interested in how the map visualised boundaries and connections between rivers and land and sea. One person wrote: “Correlation between the mountain ranges and watersheds is easily observed on this map, even without the topographic information.”
In this way, the rivers map offered the landscape in a new or interesting perspective. It provided information in a way that seems to have addressed questions held by diverse groups of people.
Finally, people were able to engage with the map and point out errors, which could then be fixed.
Of course, not all content that ticks these boxes will go viral. But, as public engagement becomes more and more important to society, it’s useful for scientists to know what canwork.

